The Pacino Frontend RTL Is Complete
Abstract
The RTL for the Pacino frontend is complete and released as fe-1.0.0.
Pacino is an 8-issue out-of-order RISC-V core targeting the RVA23S64
profile. The frontend covers branch prediction, the fetch target queue,
instruction fetch, the L1 instruction cache, address translation and
protection for fetch, the instruction buffer and decode.
The release comes with 24 demonstrations of frontend behavior. Each has a write-up, diagrams and a waveform that opens in Surfer in a browser, with nothing to install.
The frontend was designed by one architect directing LLM agents. Every IA task behind it is published with its prompt, results and assessment.
This post summarizes what is in the release, what has been verified and what has not, and what comes next.
What is in the release
The frontend RTL is about 29,000 lines of SystemVerilog, comments included, with about 75,000 lines of testbench code.
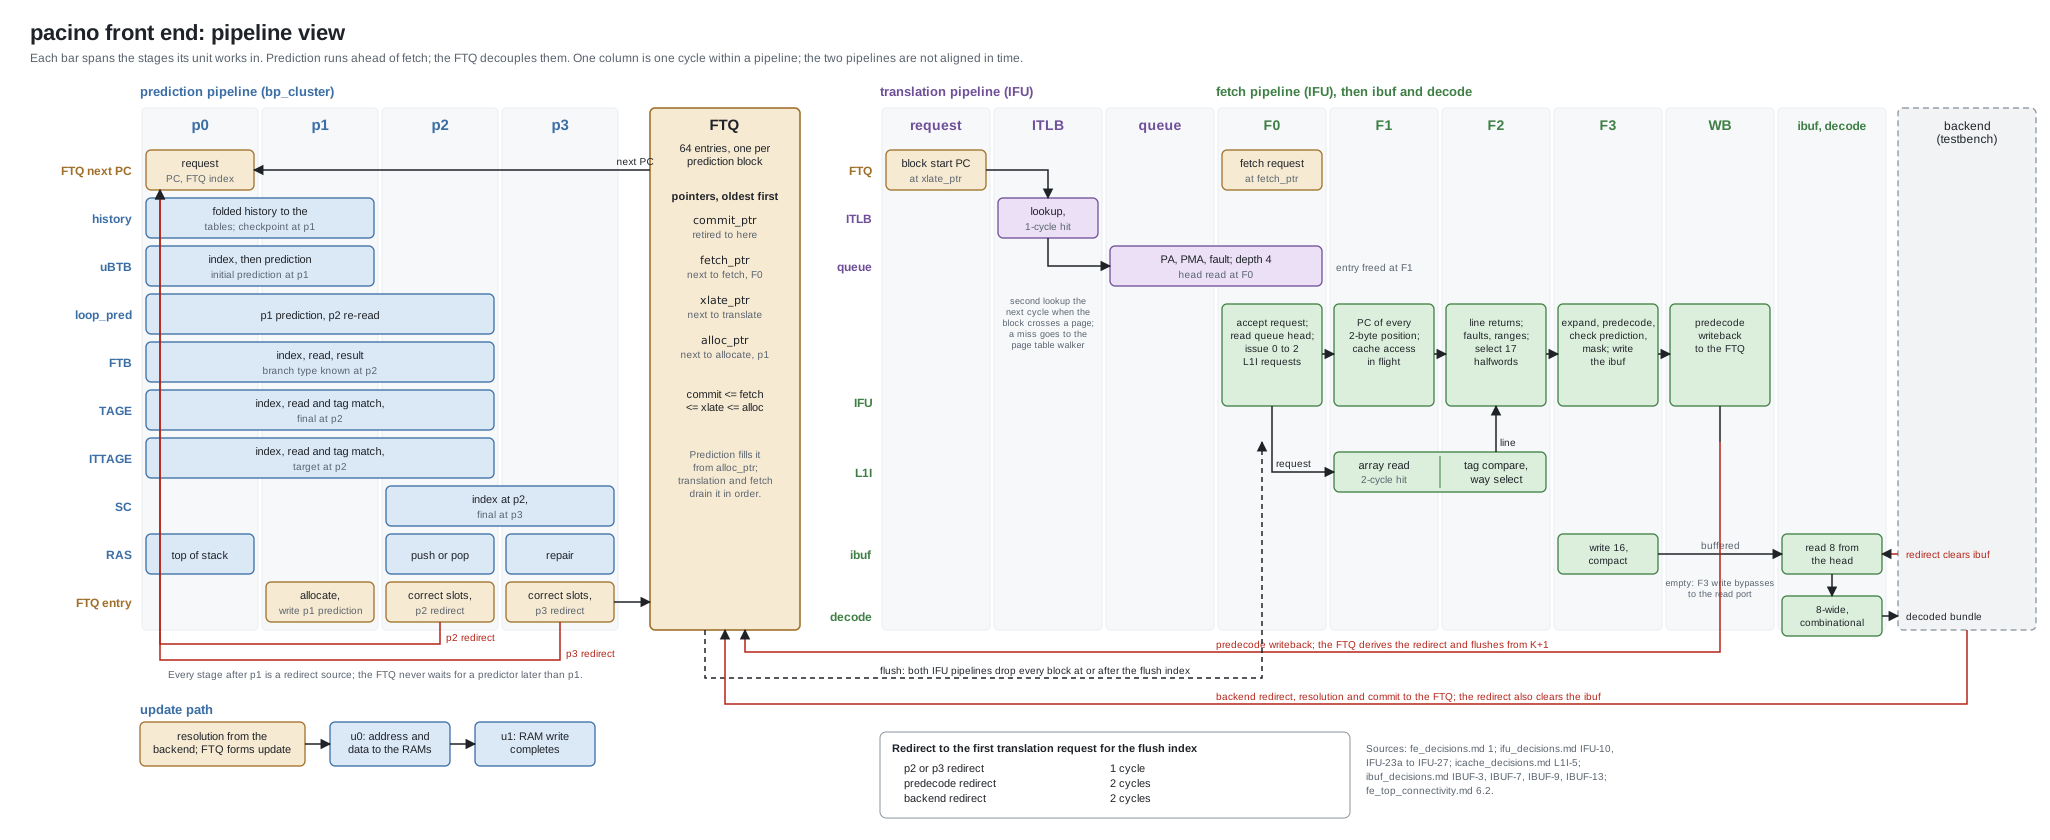
- Branch prediction unit. Seven predictors in a four-stage pipeline. At p1 the uBTB and the loop predictor give the first prediction. At p2 the FTB, TAGE (a bimodal base and four tagged tables), ITTAGE and a 48-entry RAS refine or override it. At p3 the statistical corrector makes the final direction correction.
- Fetch. The fetch target queue, the instruction fetch unit, the L1 instruction cache and the instruction buffer.
- Translation and protection. The ITLB, the page table walker and the PMP/PMA checker.
- Decode. 8-wide, covering RV64, RVC and RVV.
fe_top, which integrates the above and is driven by a testbench backend.
The pipestage view below shows the prediction pipeline (p0 to p3), the FTQ, the translation and fetch pipelines and the decode output. Select it to open it at full size. The block view is on the Frontend Overview.
The demonstrations
The 24 scenarios, FD-01 to FD-24, run programs through fe_top and show
one behavior each. The Showcase
has the write-up for each, and the workbench
lists all 24 with a link that opens each waveform in the browser, with the
signals for that scenario already loaded.
| FD | Demonstration | What it shows |
|---|---|---|
| FD-01 | Reset and init | Reset and SRAM initialization |
| FD-02 | Steady state | Steady-state prediction and fetch |
| FD-03 | Two branches | Two branches in one prediction block |
| FD-04 | p2 override | An FTB hit at p2 corrects a uBTB miss |
| FD-05 | p3 override | The statistical corrector overrides at p3 |
| FD-06 | Loop predictor | Loop trip count learned and the exit predicted |
| FD-07 | Calls and returns | Return address stack push and pop |
| FD-08 | Indirect jump | ITTAGE predicts an indirect target |
| FD-09 | TAGE | Provider, allocation and use_alt_on_na |
| FD-10 | Predecode redirect | Predecode corrects the prediction |
| FD-11 | Backend mispredict | Redirect from the backend after a mispredict |
| FD-12 | Predictor training | Updates routed by branch type; the single-ported FTB |
| FD-13 | L1I | Hit, miss and MSHR merge |
| FD-14 | Translation | Sv39 walk, Sv39x4 nested walk and Svadu CAS |
| FD-15 | Fetch faults | Page, access and guest-page fetch faults |
| FD-16 | Page crossing | A prediction block crossing a page |
| FD-17 | Compressed code | Compressed and unaligned code |
| FD-18 | Uncached fetch | Fetch from an uncached region |
| FD-19 | FENCE.I and cbo.inval | Instruction cache maintenance |
| FD-20 | Backpressure | A decode stall propagating back to the p0 request |
| FD-21 | Commit | FTQ commit pointer and RAS commit stack |
| FD-22 | SC on slot 1 | SC reversing slot 1 |
| FD-23 | Jump cut | A jump behind two conditionals |
| FD-24 | Call in slot 1 | A call in slot 1 |
FD-03 and FD-22 to FD-24 run in the two-slot configuration
(NUM_PRED_SLOTS=2), which predicts up to two branches per prediction
block.
The waveform for fd09_tage, as it opens in the browser:
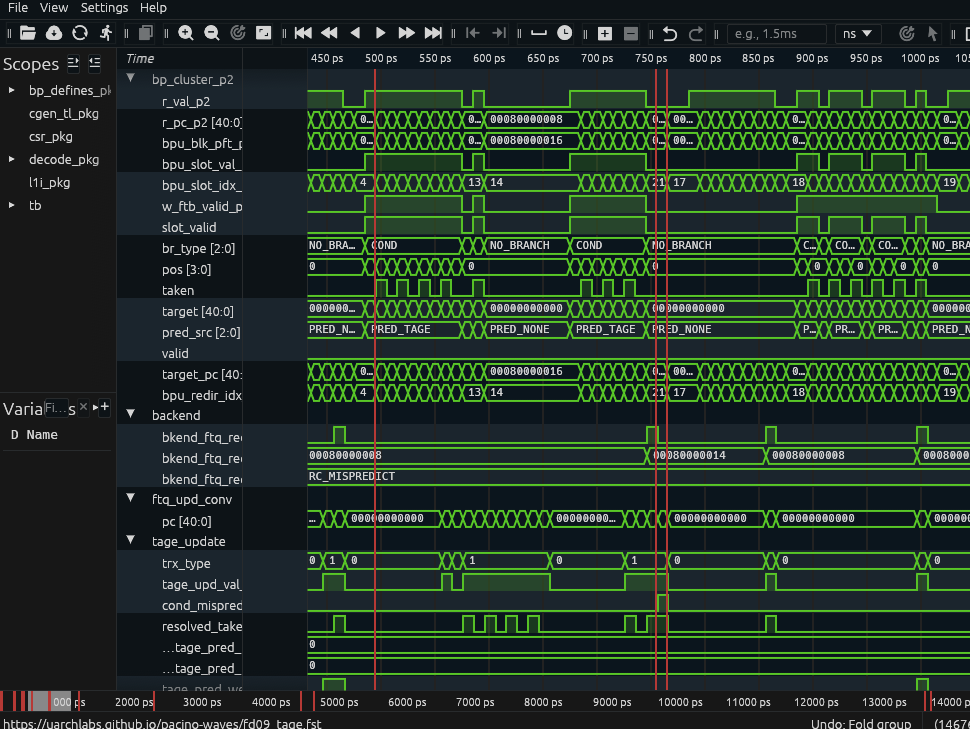
The Showcase pages, the waveforms and the release are tied to the same tag. The waveforms are published only from a release tag and only when every scenario passes, and a separate regression checks that each scenario still produces the events its write-up describes.
What has been verified, and what has not
Each block has its own unit testbench of directed tests. All of them pass in the full regression at the release tag, 274 targets with no known failures.
The branch prediction cluster has 973 checks, and mutation testing confirmed that the testbench detects each of 20 injected faults. During that work the method changed: every check must be shown to fail when the condition it guards is broken. That sweep, across all 18 unit testbenches, found and repaired exit codes, unbound assertions and watchdogs that could not fire. The details are in Branch Prediction Cluster Simulation and Mutation-based Verification.
Decode is checked against Spike, the RISC-V ISA simulator, as an independent oracle.
Formal analysis is not part of this release. No performance figures exist yet: prediction accuracy and frontend throughput on standard traces are the next measurements. No synthesis or timing results are published, and the physical design toolchain has not been chosen. Those three tracks are in progress.
The record
The project has run 250 IA tasks since the start of the development to this release, most of them on the frontend: 234 complete, 12 abandoned and kept, and 4 in progress. Each IA task was issued from a numbered PA session. The IA task browser holds each one with its prompt, the results capture, the IA output, the assessment, the files changed, the model, the runtime and the context use. The weekly posts on this blog discuss the results range by range and name the tasks they cover.
The planning documents the blocks were designed from are published as working specifications on the docs pages for the BPU, fetch, the I-cache, the MMU, decode and the CSRs, until the written descriptions replace them.
Running it
The release is at github.com/uarchlabs/pacino/releases/tag/fe-1.0.0. On Ubuntu 22.04, the quick start in the README builds the tools and runs a demonstration:
git clone --recurse-submodules https://github.com/uarchlabs/pacino
cd pacino && . tools/setup.sh
tools/build_tools.sh
make -C examples/fe_demo view S=fd09_tage
./tools/regress.sh
Where to go for more information
The demonstrations are the best place to start. The demo explainer describes how the scenarios are built and how to read their waveforms Each demo description page then walks through that one behavior, lists the events, lists the signals in the waveforms and with a one-click link to the waveform for that scenario.
For the design itself, start at the frontend specification. It walks through both diagrams, and the block pages under it hold the working specifications: the decisions, rules and interfaces each block was built from.
The weekly posts on this blog cover how each block was designed and verified, and the IA task browser has every task they cite.
What comes next
The frontend remains the current phase. The work now shifts from RTL to four tracks:
- the documentation, released as further showcase sets
- LLM-augmented formal analysis
- performance analysis and modeling, starting with branch prediction on standard traces
- LLM-augmented physical design, on FPGA and open-source PDKs.
The mid-core and backend will follow the same methodology. Questions and reports are welcome as issues.